How Liberal Is America?

When you can measure what you are speaking about, and express it in numbers, you know something about it; but when you cannot measure it, when you cannot express it in numbers, your knowledge is of a meagre and unsatisfactory kind.
Lord Kelvin
The American founders did not invent liberal government. John Locke gets credit for that, if any one person does. But the Americans were the first to try actually to set up a government according to classical liberal principles. Two and a half centuries later, though, at least by my calculations, we are barely hanging on to our status as a highly liberal democracy.
No, this is not another rant about the damage being perpetrated by Donald Trump and his followers. As a dive into the data will show, the problem goes deeper than that.
Measuring liberalism
In applying Lord Kelvin’s maxim to the subject of classical liberalism, I have found Kevin Vallier’s book, Trust in a Polarized Age, to be a useful starting point. In that book, Vallier introduces the concept of liberal rights practices, in which he defines as rights that are “recognized in constitutional law, exercised regularly by the people, and embodied in public policy.” That definition treats liberal rights practices not just as values or aspirations, but as observable characteristics of public policy to which it is possible to assign numerical scores.
Vallier lists five liberal rights practices, which he refers to as democratic constitutionalism, markets and private property rights, freedom of association, electoral democracy, and social protection policies. My own list is conceptually similar, with modifications as needed to better fit the available data. (See here for complete data.)
- Quality of governance focuses on executive constraints, government integrity, rule of law and government effectiveness.
- Quality of market institutions covers property rights, contract enforcement, investor protections, and quality of regulation.
- Personal freedoms derive from policies and institutions that protect freedom of speech and association, freedom from discrimination, and agency.
- Procedural democracy is democracy in the narrow sense of regular and fair elections with open participation.
- Social protection policies are measures that aim to mitigate extreme inequality and ensure that basic needs for food, shelter, health care, and personal safety are adequately met.
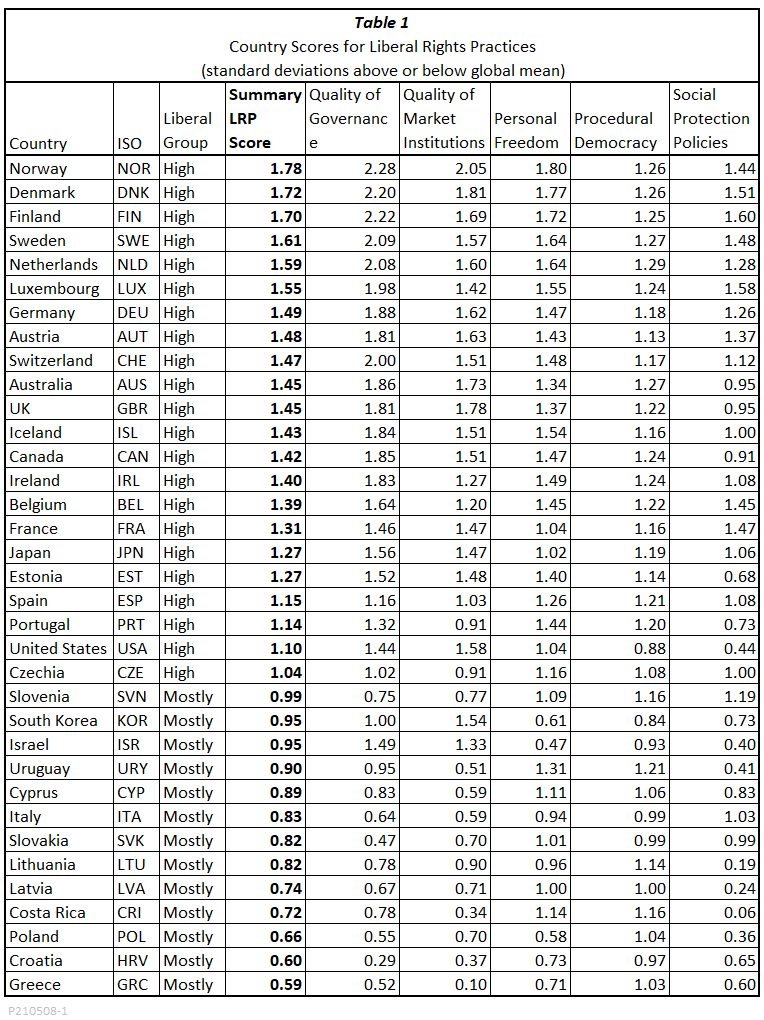
Using data from the Legatum Institute’s Prosperity Index, supplemented by several other sources, I have scored 112 countries on each of these five social protection policies, and assigned a summary liberal rights practice (LRP) score that is an average of the component scores. Using standardized versions of the scores that show the number of standard deviations by which a country exceeds (positive score) or falls short (negative score) of the global mean, I divide the 112 countries into four groups:
- Highly liberal. Twenty-two countries that score at least one full standard deviation above the mean on the summary LRP score and have positive scores for each of the five components.
- Mostly liberal. Thirteen additional countries that have LRP scores at least half a standard deviation above the mean and positive scores on each of the components.
- Partly liberal. Twenty-two more countries that have positive LRP scores but fail to meet all the requirements for highly or mostly liberal. Three of them (Chile, Mauritius, and Romania) have summary LRP scores over 0.5 but have negative social protection scores. The rest all have LRP scores between 0 and 0.5, with a scattering of negative scores on individual components.
- Not liberal. Seventy-seven countries with LRP scores of 0 or lower. Many of them have negative scores on all five components.
Table 1 shows scores for the 35 mostly and highly liberal countries that are the main focus of this essay. The United States ranks 21st on the list. Its respectable but not outstanding LRP rating of 1.10 is the next to lowest in the highly liberal group. The United States does well in quality of governance and market institutions, but its scores for procedural democracy and social protection policies are not so impressive. To see just what is holding us back, let’s look more deeply into the underlying data.
Liberalism and income
The first important finding is that liberalism is highly correlated with overall prosperity, as measured by gross national income per capita. Figure 1 shows a scatter plot for all 112 countries in our sample. The dark red dots represent highly liberal countries, the bright red dots those that are mostly liberal, and the blue dots those that are partly liberal or not liberal. For all countries together, the correlation is R = 0.90; for the 35 mostly and highly liberal countries the correlation is R = 0.81.
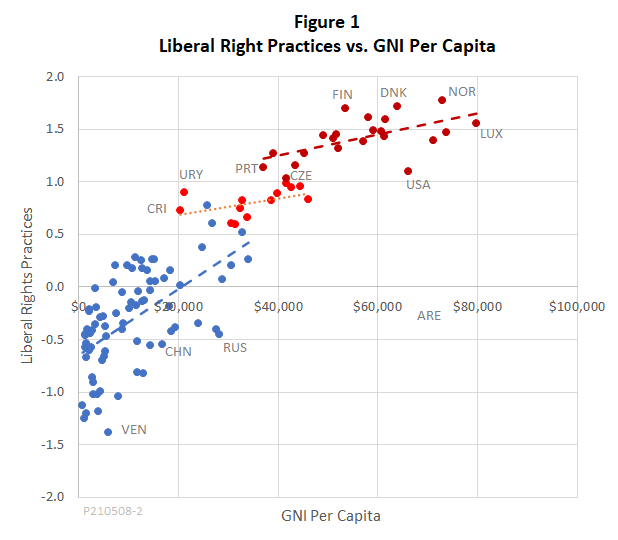
Correlations do not show causation, so we can’t be sure whether liberalism causes countries to become prosperous, or prosperity causes them to become liberal. Probably a little of both. Although incomplete data leaves them off the chart, there are at least a few countries that are both wealthy and illiberal. Partial data for rich oil producers, such as Saudi Arabia and Qatar, show poor scores for governance, market institutions, personal freedom, and democracy. The one truly prosperous and illiberal country whose wealth is not based on oil is Singapore. Singapore has strong scores for governance and market institutions combined with negative scores for personal freedoms and democracy. Its social protection policies also have many admirers. Before the Beijing government took full control, Hong Kong fit the same pattern.
It is important to take the high correlation of liberalism and income into account when making international comparisons. To show why, consider the trendlines shown in Figure 1 for the blue, red, and dark red groups. It is clear at a glance that the underperformance of the United States is even more striking when viewed against its high level of income. It lies farther below the highly liberal trendline than any other country in its group – much farther below it than Czechia, the only highly liberal country that has a lower absolute LRP score. In fact, the LRP score for the United States is only slightly higher than that of Uruguay, which has an income per capita not quite a third as high.
To see the sources of this underperformance, we need to dig deeper into the data underlying the five individual liberal rights practices that make up the overall LRP score.
Quality of governance
Among the 35 mostly and highly liberal countries, the United States ranks 20th in quality of governance score. That score, in turn, is based on four elements from the Legatum database. Of these, the best U.S. ranking is a 6th place for “government effectiveness,” which measures the ability of the government to carry out its chosen policies, to coordinate conflicting objectives and to replace failed policies with better ones. The next best U.S. ranking within the governance group is 16th of 35 for “government integrity,” that is, absence of corruption. The U.S. ranking for “rule of law” is a disappointing 20th.
The aspect of governance that most holds the United states back is “executive constraints,” for which it ranks 26th of 35. That component includes the effectiveness of checks on the executive by the legislative and judicial branches, as well measures of whether behavior of the executive branch is subject to effective outside audit and whether violators meet with sanctions.
Quality of market institutions
Quality of market institutions is the liberal rights policy component for which the United States has the highest ranking, 9th out of the 35 mostly and highly liberal countries. Only two countries, Norway and the UK, rank higher in all four of the separate elements that make up this component.
The United States has a strong ranking of 7th for “investor protection,” an element that includes indicators of the status of shareholders in corporate governance, the quality of the bankruptcy process, and the effectiveness of accounting and auditing systems. It ranks 9th for “contract enforcement,” and for “protection of property rights,” it scores right in the middle of the pack, at 16th.
The lowest U.S. ranking in the market institutions category is a 17th place for “regulatory quality.” A great deal of ink has been spilled on the issue of whether overregulation is a major factor holding back the U.S. economy. Elsewhere, I have argued that casting the issue as one of “too much” or “too little” regulation is misleading. Well-implemented regulations can sometimes do better than the court system in protecting consumers and businesses against common law torts like fraud and pollution. For example, would you rather go to a restaurant whose kitchen is regularly inspected for cleanliness, or take your chances and sue if you come down with a food-borne illness? On the other hand, regulations whose main purpose is the facilitation of rent seeking, such as occupational licensing, restrictive zoning, or excessive protections of intellectual property, definitely need reform.
Personal freedom
For those of us who grew up singing songs about “the land of the free,” it may come as a shock to find that the United States scores poorly for personal freedom, with an overall ranking of 25th out of 35. Among the 22 highly liberal countries, only France and Japan rank lower.
The best U.S. freedom ranking, at 16th, is for the element that Legatum calls “agency.” The agency score, in turn, is based on several indicators that reflect the ability of people to act in accordance with their own desires, without state interference. U.S. does well on freedom of movement, women’s agency, and personal autonomy, but poorly on criminal due process, a category that includes living conditions in jails and prisons.
The United States ranks a little lower, at 18th, for “freedom of assembly,” but there is not much to be concerned about here. The freedom of assembly scores are close together for all highly liberal countries. Much the same is true for freedom of speech and information, where the U.S. ranking is only 25th out of 35. For both of these, the U.S. score is more than a full standard deviation above the global mean.
The fourth personal freedom element, “discrimination,” is another story, however. On several indicators of discrimination by gender, ethnicity, and socio-economic status, whether by police, courts, schools, or other institutions, the United States receives disappointingly poor scores. Those are only partly offset by better ratings for religious freedom and LBGTQ rights, the latter helped by the legalization of gay marriage. Overall, the U.S. ranking for discrimination is 30th out of 35, the very lowest among the 22 highly liberal countries.
Procedural democracy
All of the preceding rankings have been based on data from the Legatum Institute. Of the three variables that go into my scoring of procedural democracy, only the first comes from that source. Legatum refers to its measure of procedural democracy as “government accountability,” and ranks the United States 24th out of 35.
The other two inputs to my democracy score come from Freedom House, which is even less kind to the country that invented “government of the people, by the people, and for the people,” and fought a bloody civil war to preserve it. Freedom House ranks the United States 33rd out of the 35 mostly and highly liberal countries on “political pluralism and participation,” and dead last for “electoral process.” When the three indicators are averaged, the U.S. overall score for procedural democracy ranks 34th out of 35.
Social protection policies
Social protection policies are the fifth component of my measure of liberal rights practices. The overall social protection score has three elements.
The first element has an average of eleven Legatum indicators that align with the two lowest levels of Abraham Maslow’s hierarchy of needs. These comprise physiological needs such as food and shelter as well as safety needs, such as personal security and health care. The Legatum data focus on satisfaction of needs at minimum acceptable levels rather than average levels, for example, the percentage of the population without adequate shelter rather than the average square feet of living space per capita. The United States ranks 27th out of the 35 mostly and highly liberal countries for satisfaction of basic needs. Measures of crime, homelessness, and poverty rates are among those that pull the U.S. ranking down.
Gini indexes of income inequality are the second element that goes into the social protection score. The version of the Gini index that I use comes from a study by Laurence Chandy and Brina Seidel of the Brookings Institution, who adjust World Bank Gini measures to correct for underreporting of very high incomes. The U.S. Gini Index of 0.51 is the 31st most unequal of the 35 mostly and highly liberal countries, and the very most unequal among the 22 highly liberal countries.
The third element of social protection is social protection expenditures, as reported by the International Labor Organization. The United States ranks 27th out of 35 mostly and highly liberal countries in terms of social protection expenditures per dollar of gross national income.
Putting these together, the overall U.S. ranking for social protection policies is 29th out of 35, which is the lowest of all among the highly liberal group.
It might be objected that the U.S. ranking for social protection is biased down because its social expenditure component includes only on-budget spending, not so-called “tax expenditures,” such as the deductibility of employer-sponsored health insurance, mortgage interest, retirement savings and charitable contributions. However, as I have discussed elsewhere, all of those policies are structured in ways that channel the largest share of their benefits to upper-middle and higher-income families. That being the case, I do not think that including their effects would improve the U.S. rankings for social protection policies.
The bottom Line
Putting all this together gives an answer, or at least a data-nerd’s answer, to our title question, “How liberal is America?” If we compare ourselves with all of the two-hundred-odd countries in the world, or even the 112 for which good data are available, then the United States is clearly closer to the classically liberal end of the scale than the illiberal, authoritarian end. Still, it is sobering to recognize that 20 countries, some of them with significantly lower incomes, score considerably higher.
My colleagues and I at Niskanen Center spend a lot of our time thinking about how we could do better. A social safety net that is both more work-friendly and less full of holes. A healthcare system with affordable access for everyone. An immigration system that does better both in terms of justice and in attracting skilled contributors to our economy. These and other objectives are the subject of a Niskanen manifesto titled Faster Growth, Fairer Growth. A brand new Niskanen team is leaning into problems of criminal justice reform, which, as the data show, is another area that needs work.
There is a long way to go, but we need to keep trying. If we stand still, we will continue to slip backwards.
Featured Image is Leaders at the Head of the Civil Rights March on Washington